


Mapping the Highest Incarceration Rates in the United States
A geographic and demographic analysis of the U.S. penal system, examining state-level disparities and federal population trends.
The United States utilizes incarceration at vastly different rates depending on geography. While national averages provide a broad understanding of the penal system, state-level data reveal significant geographic concentrations. This analysis examines jurisdictional incarceration rates, recent trends within the federal prison population, and the demographic disparities that persist across both youth and adult systems.
Key takeaways
- The national imprisonment rate is 350 per 100,000 residents, but states in the Deep South, such as Mississippi (575 per 100,000), significantly exceed this baseline.
- More than 1.7 million individuals are currently incarcerated across the country.
- Across the United States, Black youth face a custody rate 5.6 times higher than their White peers.
- The federal prison population declined slightly by 1% between the end of 2023 and the end of 2024.
- Individuals between 35 and 54 years old represent the majority of the federal prison population assigned risk classifications.
Click to view the full-size infographic
Geographic clustering in the Deep South
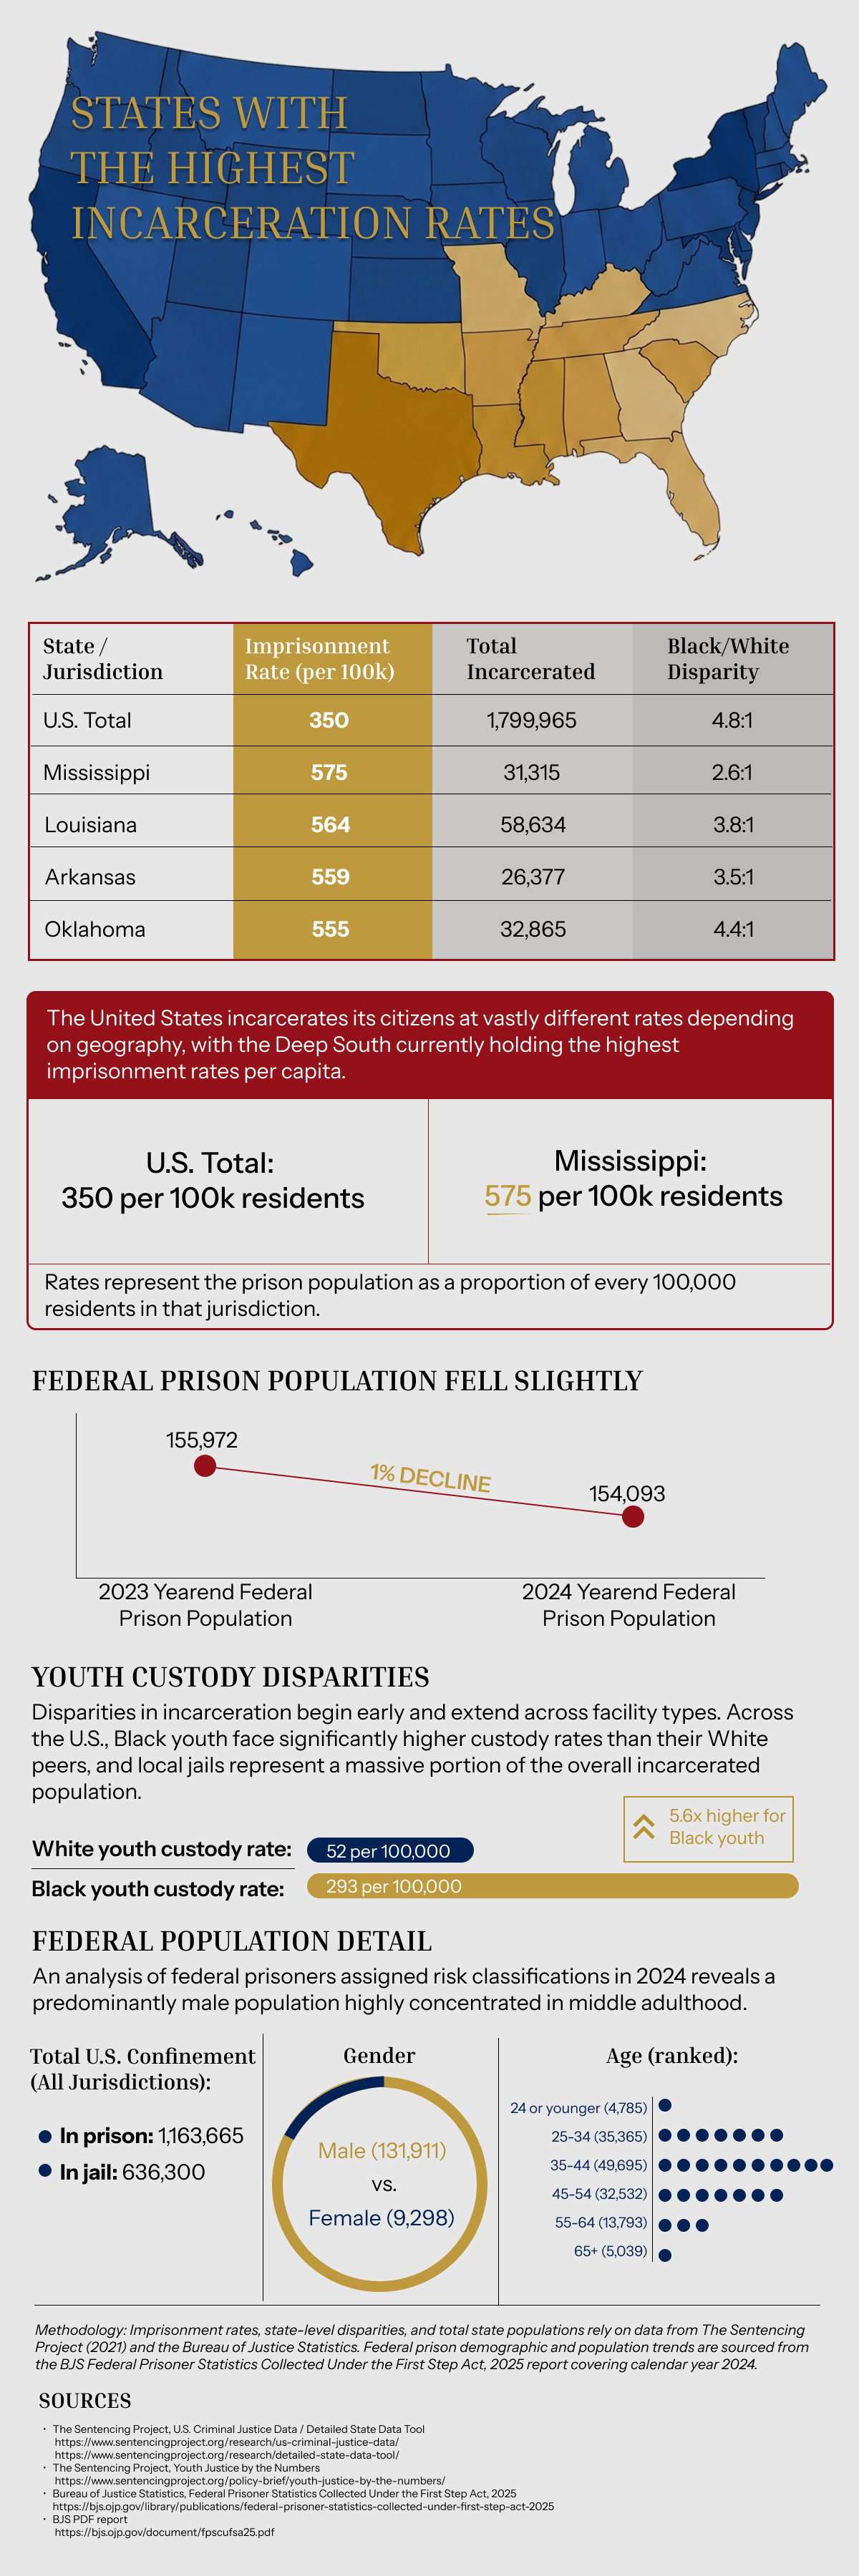
The overall U.S. imprisonment rate stands at 350 per 100,000 residents, encompassing a total incarcerated population of 1,799,965. However, this national figure obscures stark regional variations.
The Deep South consistently ranks highest for per capita imprisonment. Mississippi leads the nation with an imprisonment rate of 575 per 100,000 residents and a total incarcerated population of 31,315. This is closely followed by Louisiana at 564 per 100,000, Arkansas at 559 per 100,000, and Oklahoma at 555 per 100,000. Comparing these extreme local rates to the national average highlights how regional justice systems and local policies drive incarceration levels independent of federal trends.
Systemic disparities in youth and adult custody
Disproportionality in the justice system is evident across multiple demographics and begins early. Nationally, the custody rate for Black youth is 293 per 100,000, compared to 52 per 100,000 for White youth. This indicates that Black youth are incarcerated at a rate 5.6 times higher than their White counterparts.
These disparities continue into the adult system. The national Black-to-White disparity ratio for adult incarceration is 4.8 to 1. Even in states with the highest overall imprisonment rates, racial disproportionality remains a persistent factor. For example, Oklahoma reports a disparity ratio of 4.4 to 1, Louisiana reports 3.8 to 1, and Mississippi reports 2.6 to 1.
Understanding total confinement types and federal demographic shifts
Total U.S. confinement relies on distinct systems working simultaneously: state and federal prisons alongside local municipal jails. Across all combined jurisdictions, prisons hold 1,163,665 individuals, while local jails hold an additional 636,300 individuals awaiting trial or serving localized sentences
While state and local systems house the majority of individuals, the federal system tracks a separate, specific cohort under specialized risk classifications. Between 2023 and 2024, the year-end federal prison population dropped slightly from 155,972 to 154,093 individuals, capturing an overall decline of roughly 1%.
Demographic breakdowns of federal prisoners assigned risk classifications show a predominantly male population, with 131,911 males assigned risk classifications compared to 9,298 females. Age distribution metrics reveal that individuals in early to middle adulthood represent the largest portions of the system. The largest demographic band belongs to individuals aged 35 to 44 with 49,695 people, followed by individuals aged 25 to 34 with 35,365 people, and individuals aged 45 to 54 with 32,532 people. Older cohorts and younger demographics account for noticeably smaller slices of the federal classification system, with 13,793 individuals aged 55 to 64, 5,039 individuals aged 65 or older, and 4,785 individuals aged 24 or younger.
Regional policy trends and baseline projections
The data underscores that incarceration in the United States is not a uniform experience but rather a fragmented reality deeply influenced by geography, age, and systemic demographic disparities. While minor fluctuations occur at the federal level, the structural concentration of high imprisonment rates within the Deep South and the pronounced racial gaps in both adult and youth custody emphasize the distinct local dynamics driving the American penal system. Evaluating these standardized metrics provides a foundational baseline for understanding where the impacts of confinement are most intensely felt.
Methodology
Imprisonment rates, state-level disparities, total state populations, and overall U.S. confinement figures rely on data from The Sentencing Project (2021). Rates represent the prison population as a proportion of every 100,000 residents in that jurisdiction. Federal prison demographic and population trends are sourced from the Bureau of Justice Statistics (BJS) report, Federal Prisoner Statistics Collected Under the First Step Act, 2025, covering calendar year 2024.
About Joslyn Law Firm
At Joslyn Law Firm, our team of dedicated defense attorneys understands the severe, lifelong impact that criminal charges can have on a person’s freedom, family, and future. Serving Cincinnati, Ohio, and surrounding areas, our nationally recognized lawyers take an aggressive, proactive approach to federal and state criminal defense, protecting our clients as if they were our own family. If you are facing criminal charges, contact Joslyn Law Firm to ensure your rights are protected by an experienced advocate.
Frequently asked questions
What is the difference between a prison and a jail?
Jails are typically locally operated facilities that hold individuals awaiting trial or serving shorter sentences. Prisons are state or federally operated facilities designed for individuals serving longer sentences. Current total U.S. confinement data accounts for 1,163,665 individuals in state and federal prisons and 636,300 in local jails.
How is the imprisonment rate calculated?
The imprisonment rate is calculated by dividing the total number of individuals incarcerated in a specific jurisdiction by its population. It is expressed as a rate per 100,000 residents to allow for standardized, proportional comparisons across states with different population sizes.
What information is captured under the federal risk classification demographics?
The federal risk classification demographic data detail specific tracking assessments conducted under statutory directives such as the First Step Act. These specific figures classify a subset of the federal penal system by age and gender, showing that the current federal classified population is heavily male and concentrated between the ages of 35 and 54.
Sources
- The Sentencing Project, U.S. Criminal Justice Data / Detailed State Data Tool: https://www.sentencingproject.org/research/us-criminal-justice-data/
- The Sentencing Project, Detailed State Data Tool: https://www.sentencingproject.org/research/detailed-state-data-tool/
- The Sentencing Project, Youth Justice by the Numbers: https://www.sentencingproject.org/policy-brief/youth-justice-by-the-numbers/
- Bureau of Justice Statistics, Federal Prisoner Statistics Collected Under the First Step Act, 2025: https://bjs.ojp.gov/library/publications/federal-prisoner-statistics-collected-under-first-step-act-2025
- Bureau of Justice Statistics PDF Report: https://bjs.ojp.gov/document/fpscufsa25.pdf